
Report in your hands, just 24hrs after final N.
Go beyond just data dumps and endless sifting for findings. Knit puts a report in your hands just 24 hours after fielding wraps.
Go beyond just data dumps and endless sifting for findings. Knit puts a report in your hands just 24 hours after fielding wraps.
Insights only drive action when they’re easy to understand and ready to share. Knit doesn’t hand you a dashboard or a data dump. Once fielding wraps, your report is ready, and because research expertise and institutional knowledge are built in from the start, what comes back is a story you can feel confident in — brand-styled decks with quant and qual, video showreels, and key takeaways that feel like your research team is the one who built it. Walk into your stakeholder meeting focused on the conversation, not the deck.
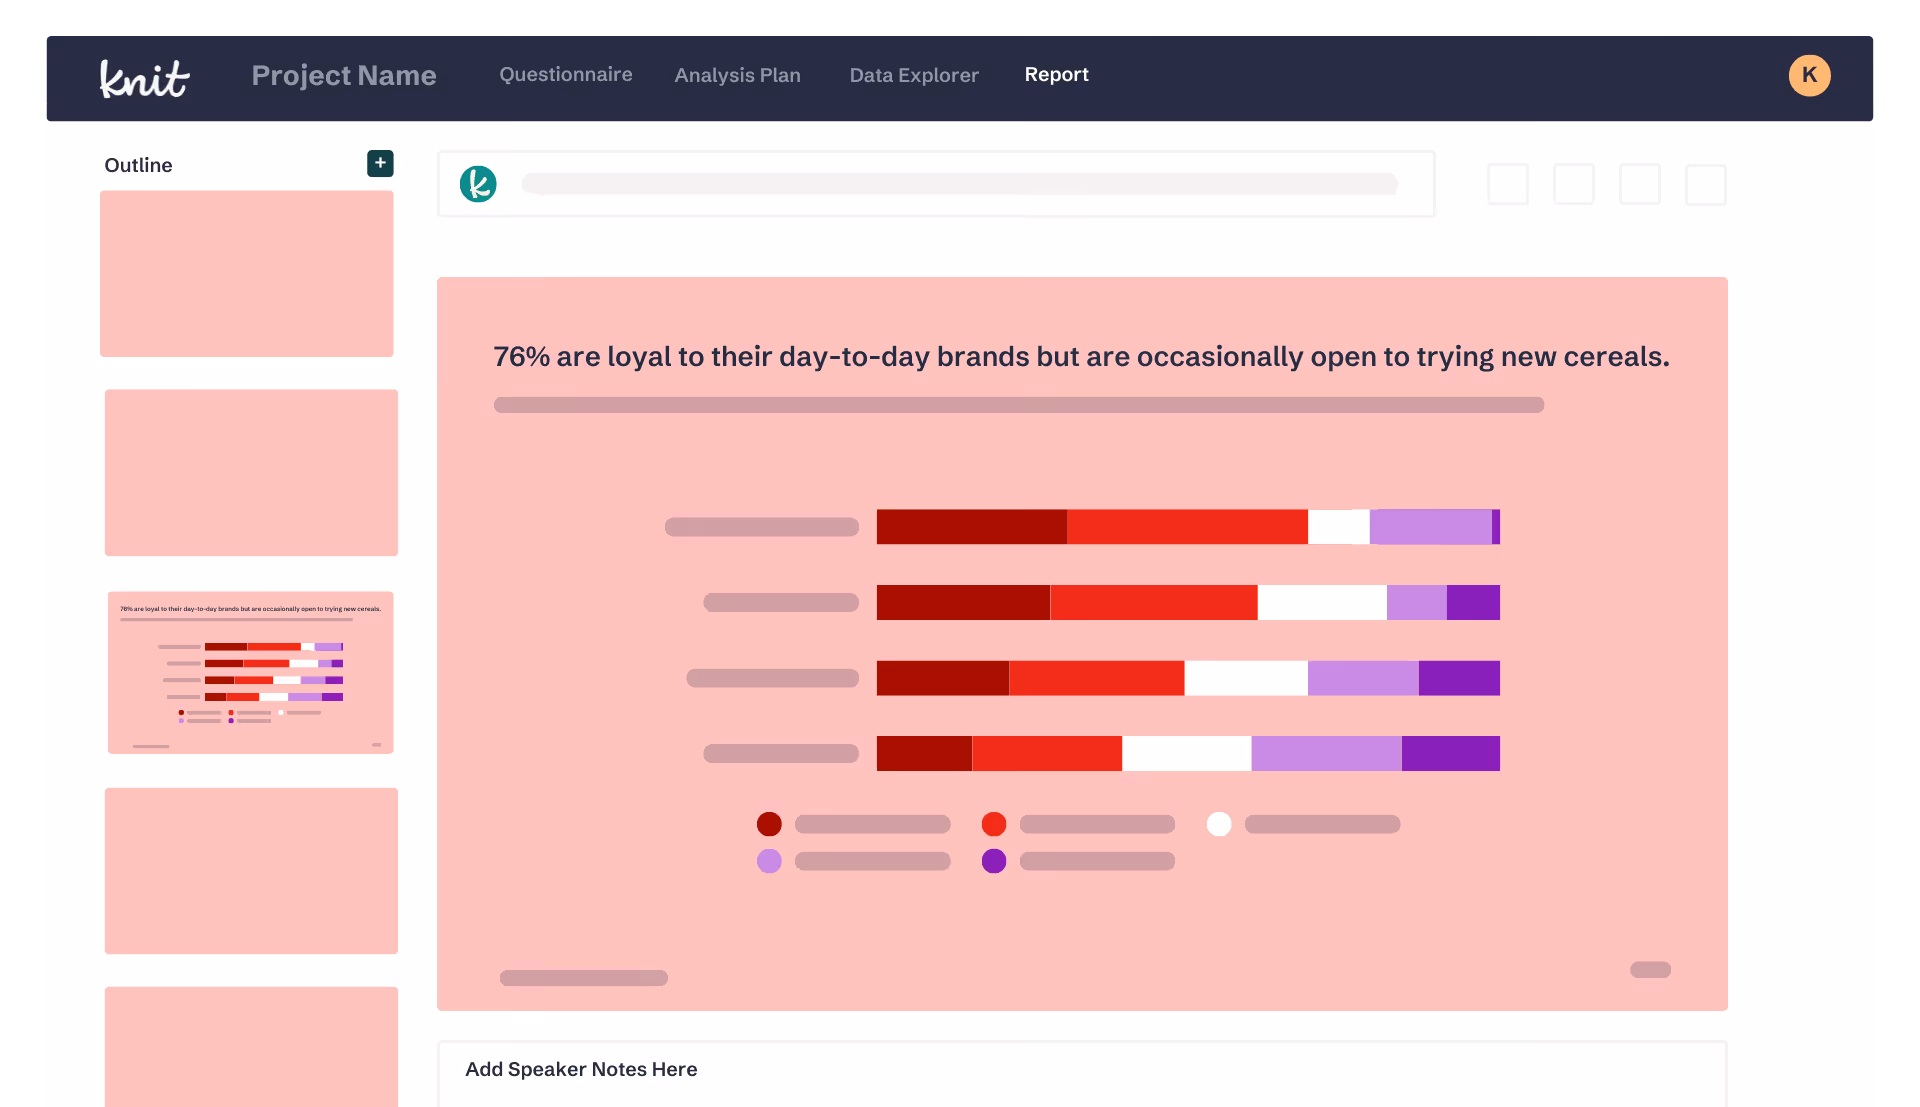
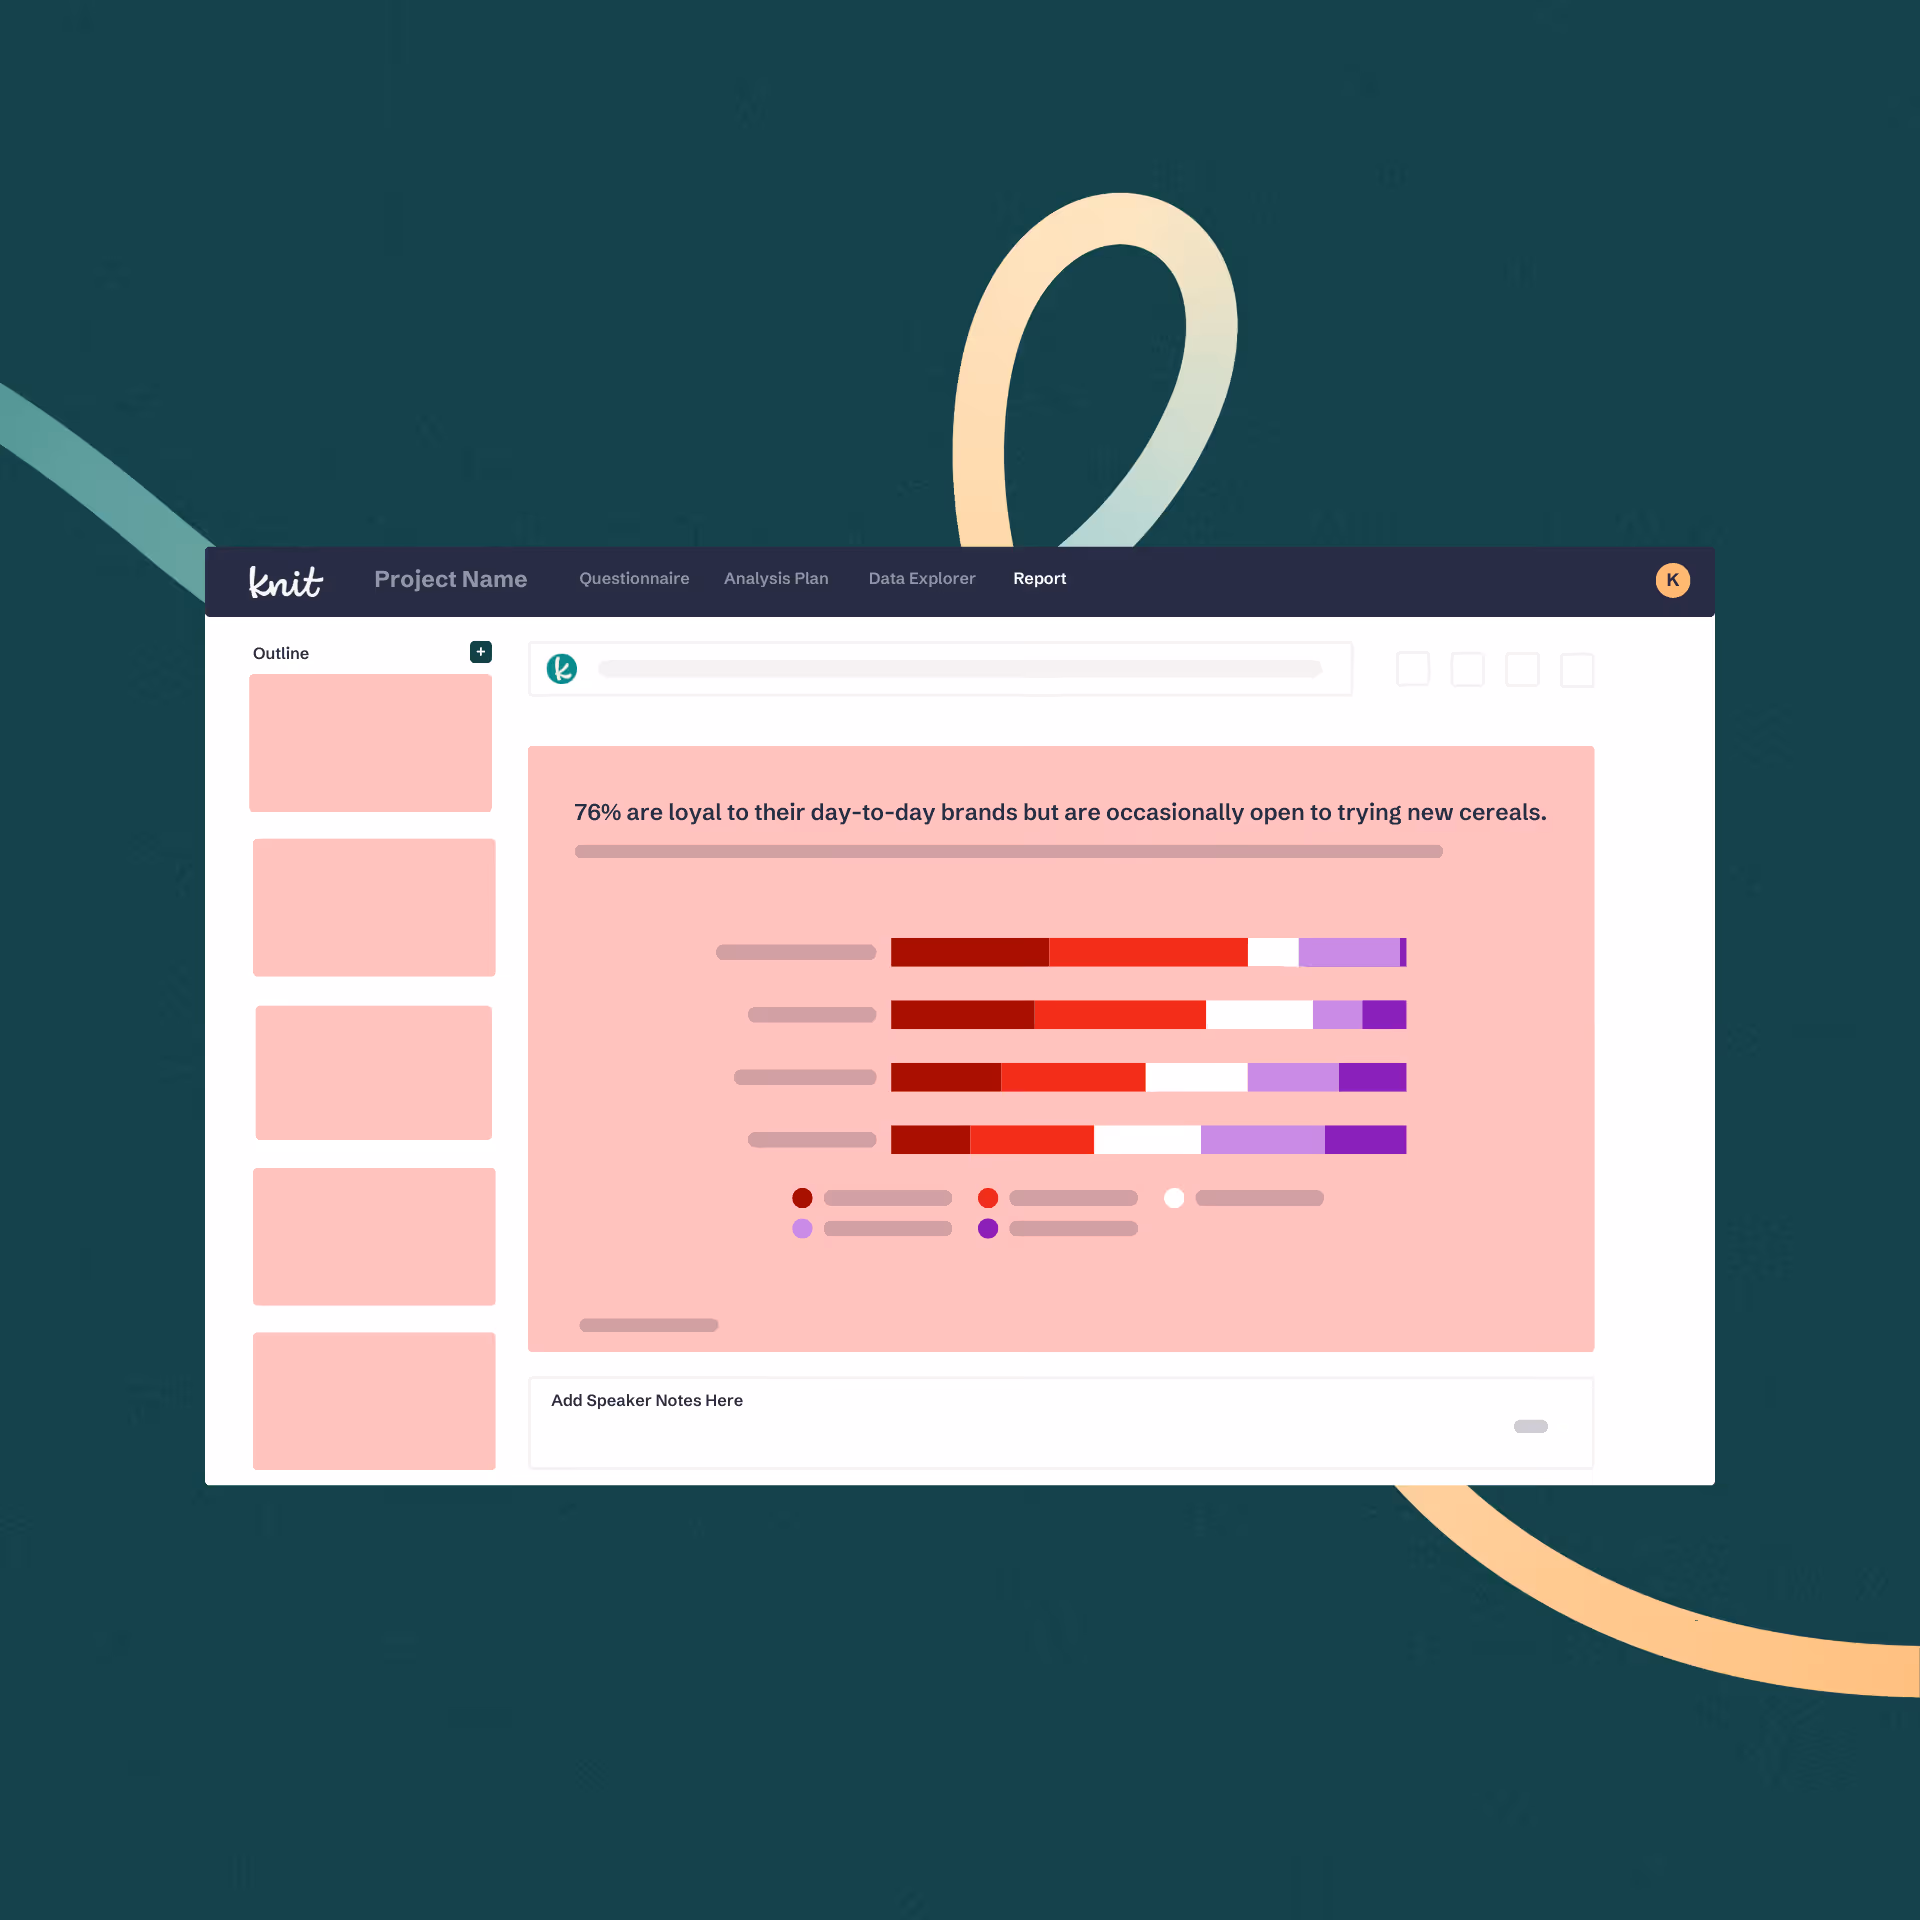
Knit generates a complete topline report — not just charts and summaries, but a full set of slides covering the most important takeaways from your study. It’s a story you can tell, built from the research up.
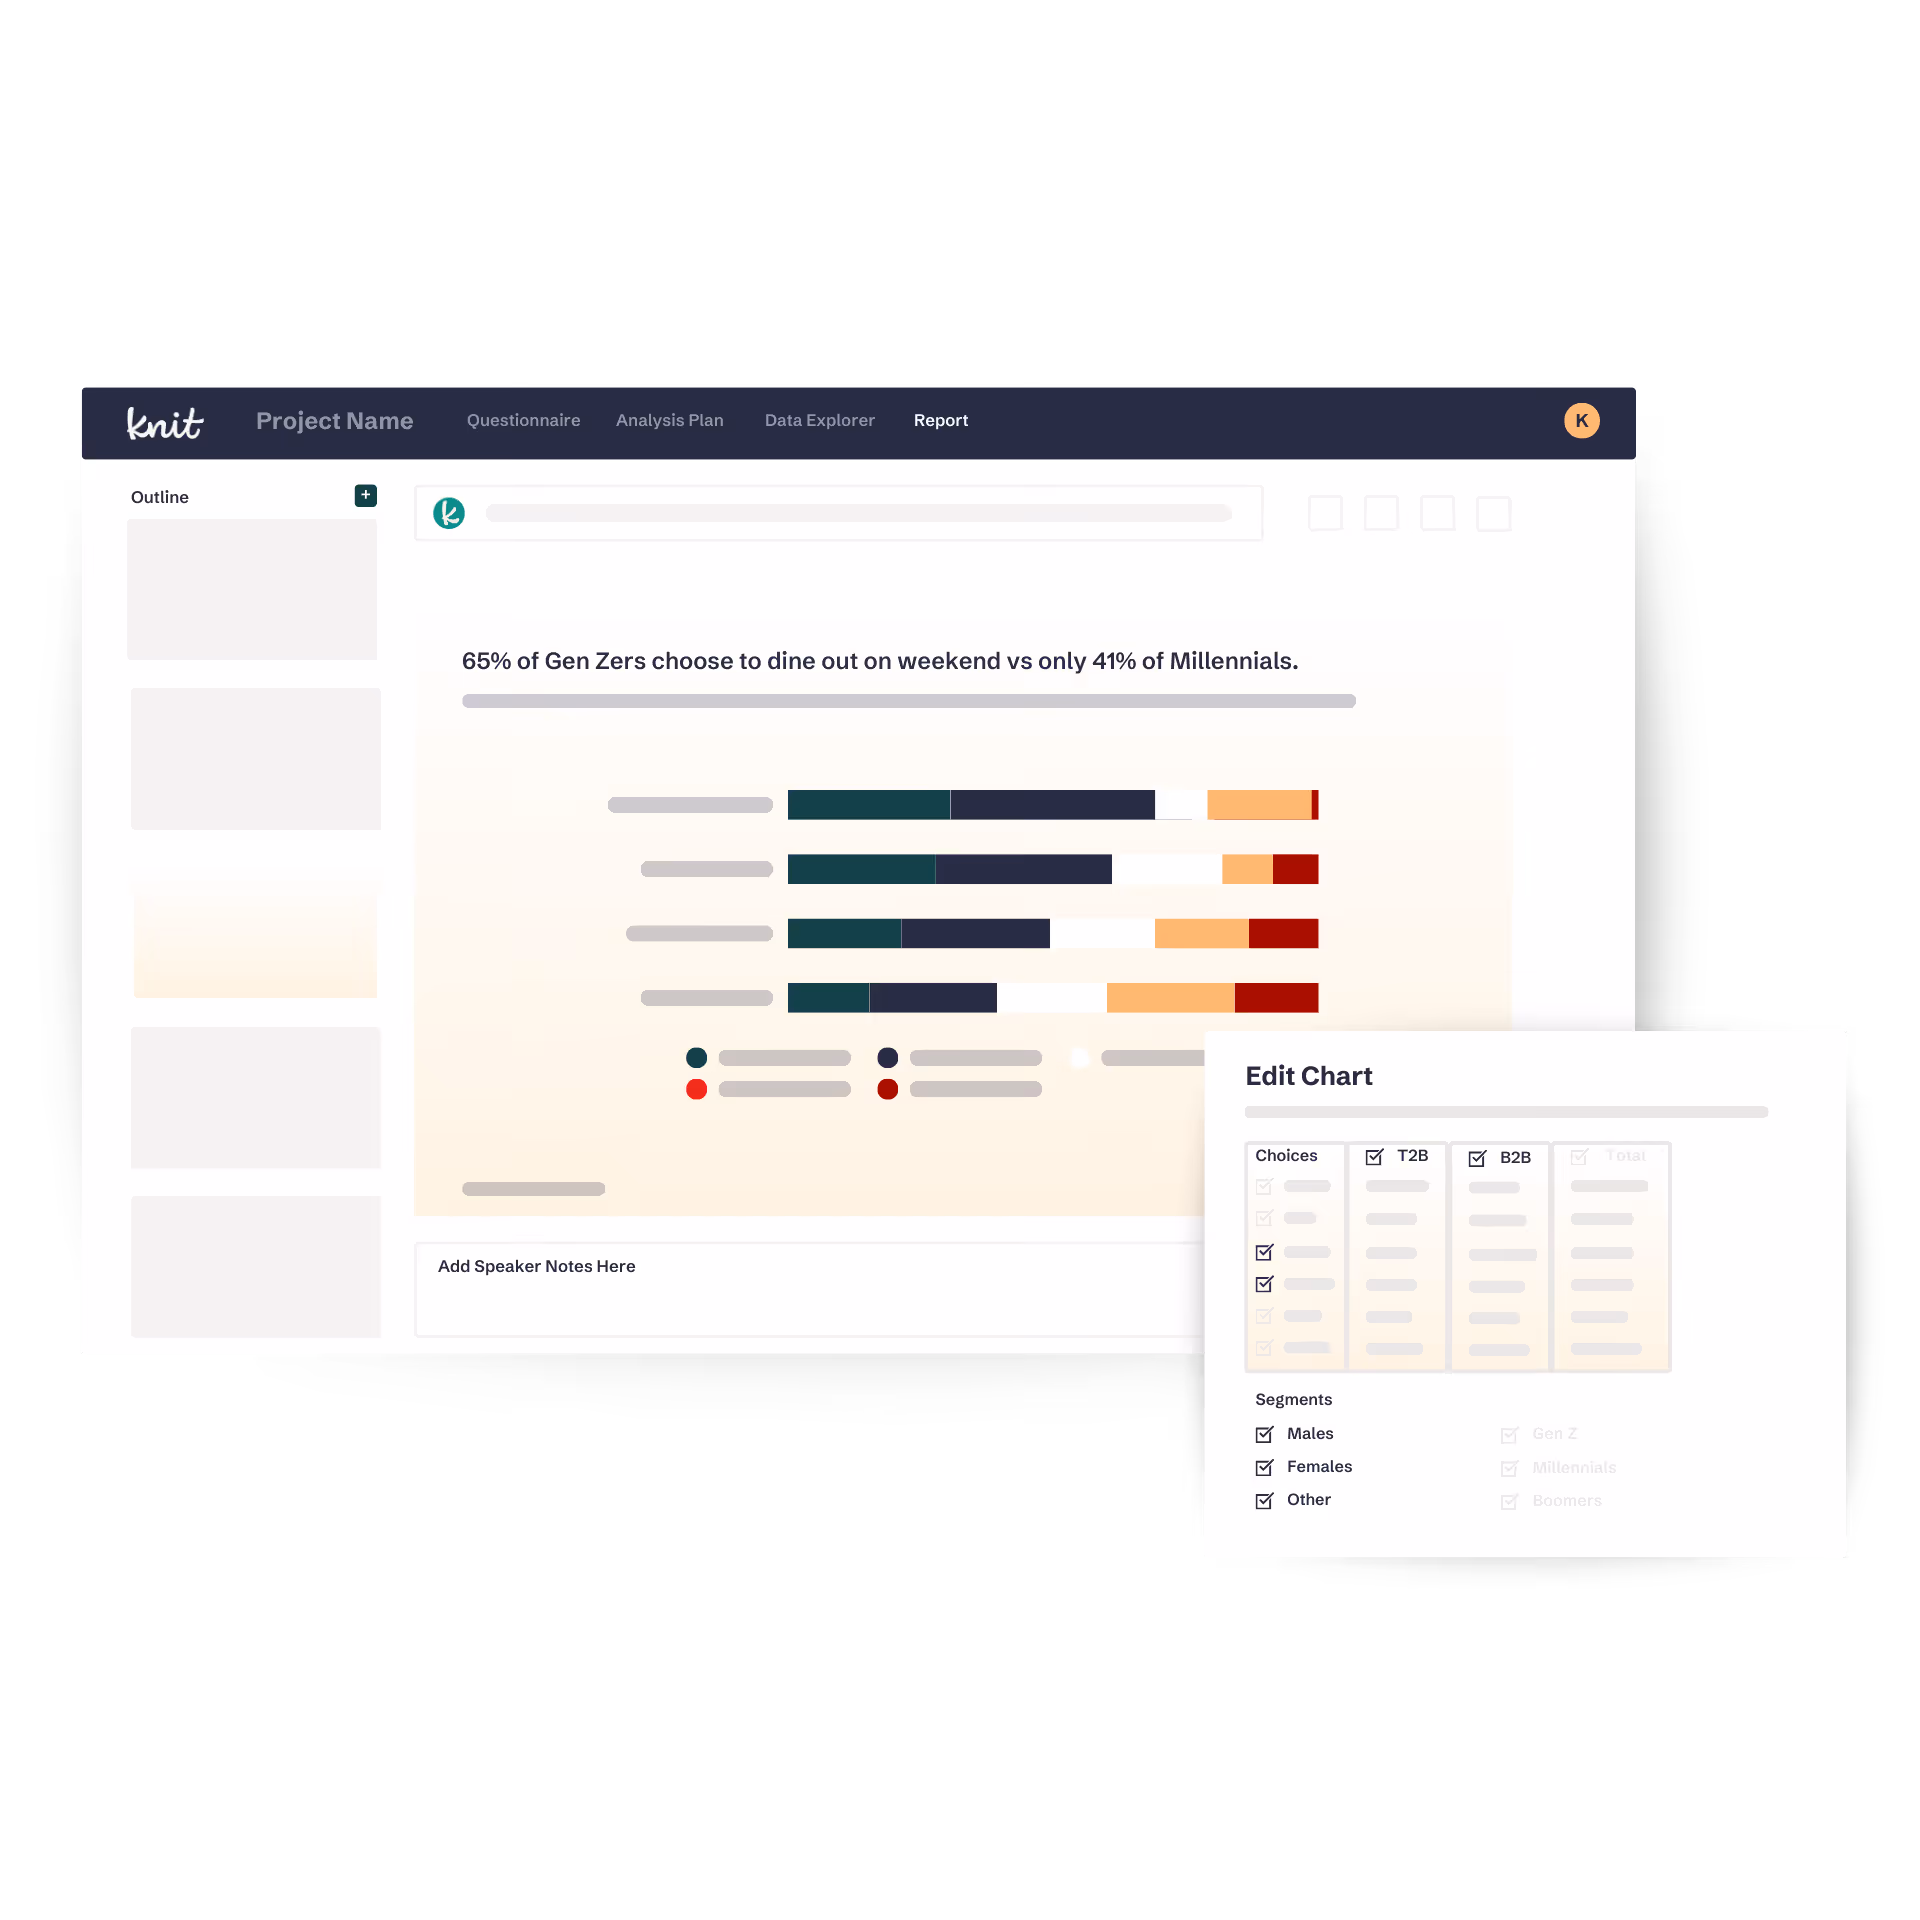
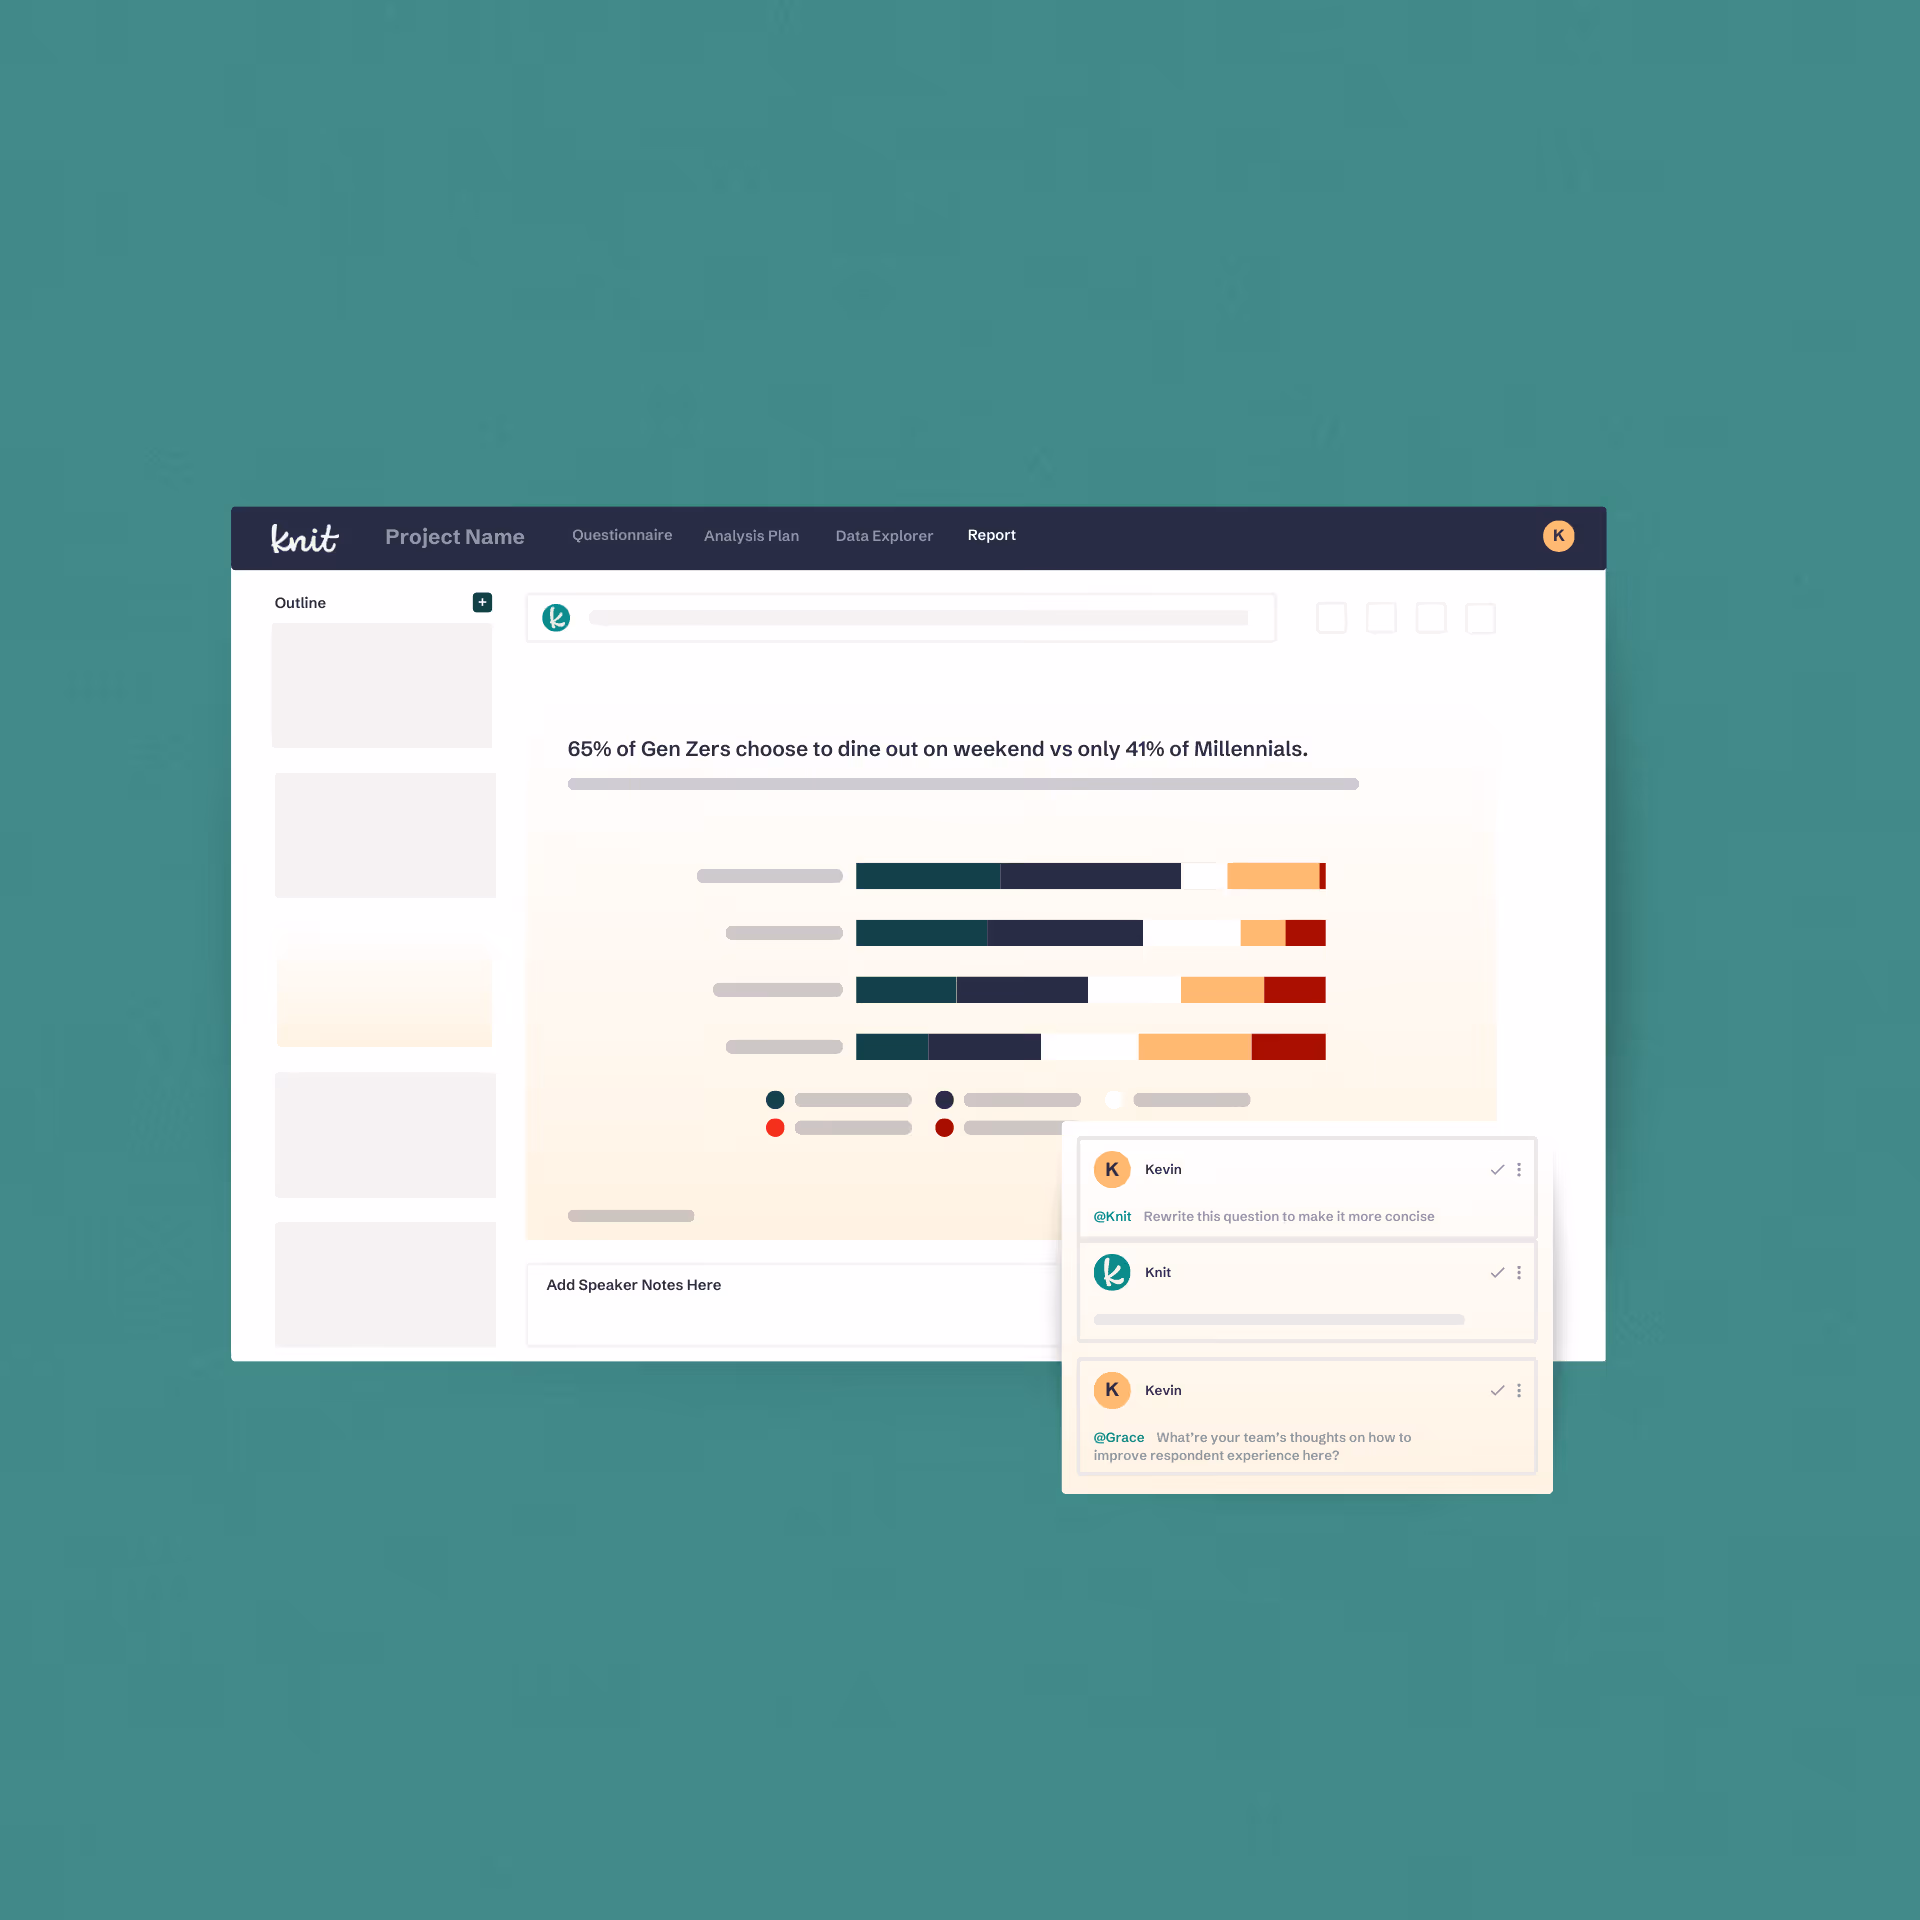
Your study’s key cohorts are pre-prepared based on your research objectives. Add cuts, apply filters, and update slides in seconds.
Have an open question about your data or don't want to do the digging and editing to craft a new slide? Just ask Knit to do it for you. Ask any open question you have about your data and apply cuts or filters to your question if needed, and Knit will draft an entirely new slide for you to include in your presentation in minutes – complete with its normal rationale, citations and more.
When your report is ready, export to PowerPoint or Google Slides in one click — high-quality insights are ready for your final touch — so you can focus on the thinking that will land with stakeholders, not the formatting of the output.
Get expert-level summaries generated moments after fielding finishes, giving you an immediate first look at the narrative. Beyond the summary, you get a fully formatted report — key takeaways, recommendations, visualizations, and video showreels — ready the moment your data comes in. Agency-quality output at the speed of AI.

Your dedicated Knit researcher isn’t just available to review your report at the end — they’re with you from scoping through delivery. They shape your methodology, understand your business objectives, and make sure the AI is working toward your actual question. That’s what makes the difference between a generic AI output and a report you can confidently use to land the insights with the business.

Timex partnered with the AI-Native Research Agency, Knit, to concept test a variety of media IP product lines and prioritize SKU development with rich consumer feedback in as little as six weeks.

Dig into how Knit is applying Researcher-Driven AI across every step of the research process.

Brief to questionnaire in minutes — AI-drafted, reviewed, programmed, and launched within a day.

Bring your own audience or tap 65M+ vetted respondents. Knit handles fielding end-to-end.

Quant and qual analyzed together, automatically — guided by your Analysis Plan, cited and sourced. Dive deeper into data yourself, or ask Knit to answer follow up questions.
A fully structured, branded report with high-quality insights. Export to PowerPoint or Google Slides in one click.


See what a complete Knit report looks like — from fielded data to decision-ready story.
Submit the form. Grab some time. Let’s chat!